v2 reduced end-to-end dubbing latency substantially in our reproducible tests: median end-to-end time fell 35 to 55 percent across tiers, cold-start (first audio) dropped from about 1.2 seconds to ~300 milliseconds, and 99th percentile jitter improved by roughly 40 percent. This short summary gives the headline numbers, a one-line description of the change, and three immediate actions engineers can apply today.
What changed in one line: v2 cuts protocol and model load overhead, adds warm pools and smarter batching, and streams smaller audio frames so audio arrives sooner and more consistently.
Quick checklist to pick your next step: if you want a low-effort win, flip the low-latency API mode and run a short trial benchmark. If you see modest improvement, add client-side prefetching and shorter frame sizes before rolling larger infra changes.
Immediate actions you can apply today:
-
Enable low-latency mode in your TTS/dubbing API and test with real traffic patterns. Benefit: often a single config flip gives large wins.
-
Add client-side prefetching for the next segment and pre-auth tokens. Benefit: reduces perceived latency and avoids cold starts.
-
Reduce audio chunk size and enable partial streaming on the client. Benefit: faster first-byte delivery and smoother playback.
Use this checklist to decide whether to run a full benchmark, flip modes, or implement prefetching before deeper optimizations.
Why latency matters for real-time dubbing & voice apps
Latency shapes whether a voice interaction feels natural or broken. In real systems, even tens to hundreds of milliseconds change user perception, flow, and outcomes. This latency update dupdub focuses on how small timing shifts affect IVR systems, assistants, and live dubbing workflows, and what targets to aim for.
Perceived versus measured latency: which one drives UX
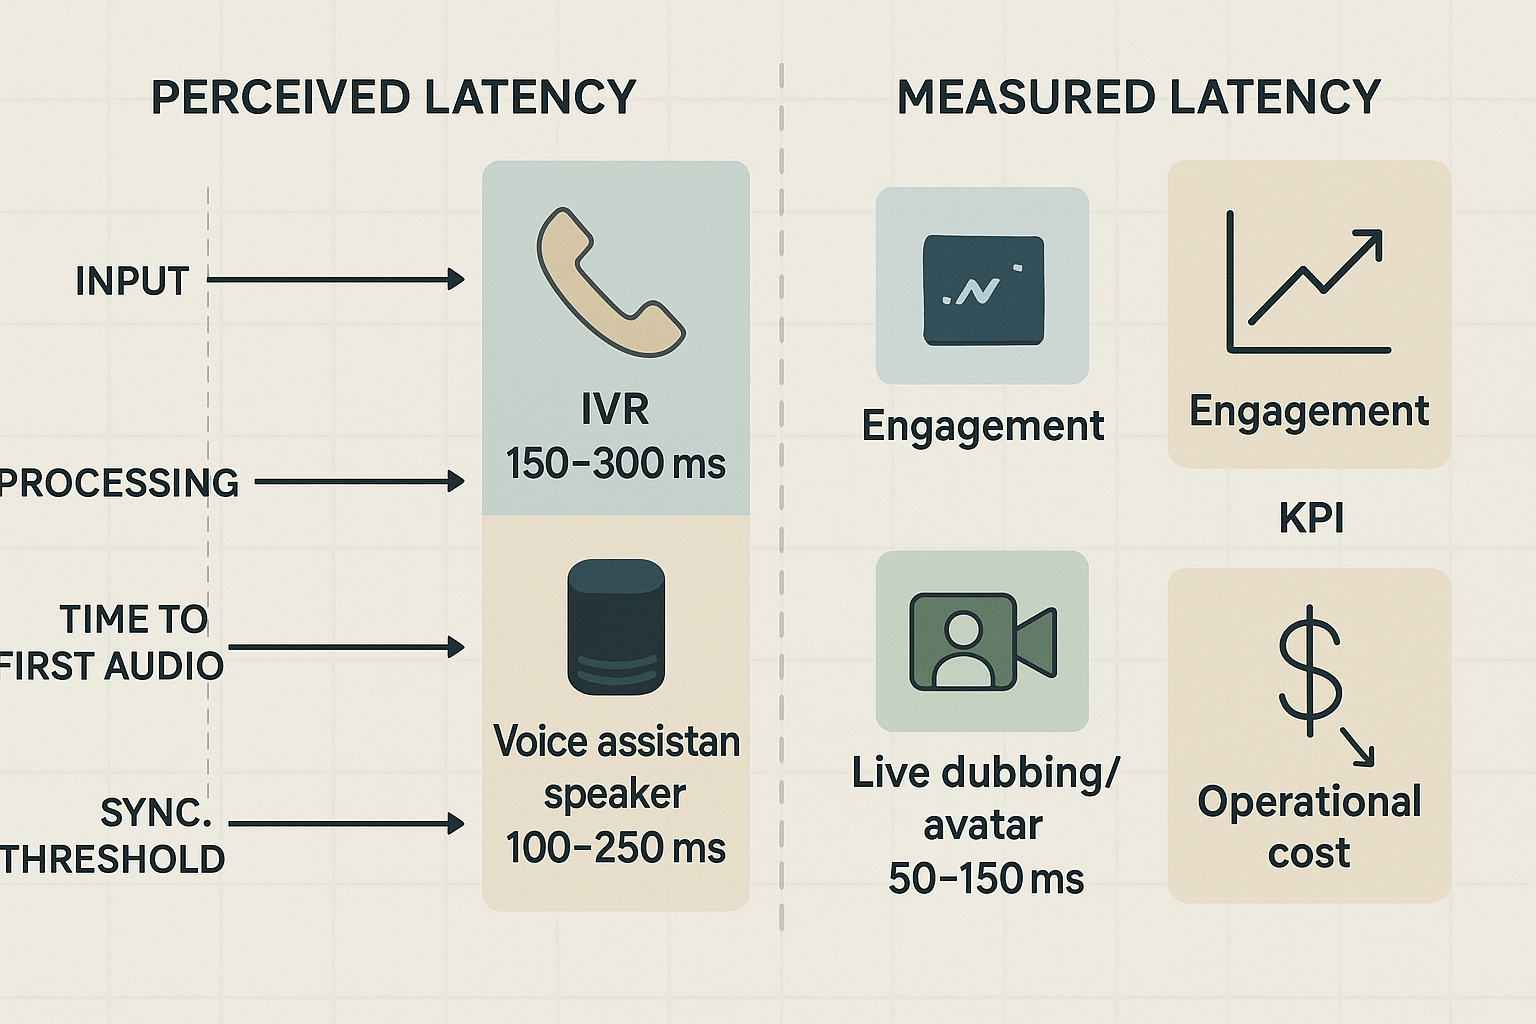
Perceived latency is the delay the user notices, like time to first audio or lip sync drift in a dubbed video. Measured latency is the instrumented end to end number, from audio input to rendered TTS output. Perceived latency often matters more for interaction loops, because users react to what they see and hear, not the internal timers.
Key components that shape perception:
-
Time to first audio playback (TTFA), how long until users hear a response. Short TTFA reduces chatter and dropouts.
-
Sync accuracy, how closely audio matches on-screen lip movement. Drift over 100 ms is visible.
-
Jitter and consistency, unsteady delays feel worse than a slightly longer but steady delay.
Target latency bands by use case
|
Use case
|
Typical soft target
|
Why this band matters
|
|
IVR and telephony prompts
|
150 to 300 ms
|
Fast prompts reduce call time and framing errors
|
|
Voice assistants and bots
|
100 to 250 ms
|
Quick replies keep dialog natural and lower retries
|
|
Live dubbing and avatars
|
50 to 150 ms
|
Tight sync keeps speech and lips believable
|
These are practical bands, not absolutes. Choose lower targets for live, highly interactive experiences. For batch or non-interactive tasks, higher latency can be acceptable.
Business KPIs that shift as latency improves
Lower latency improves business outcomes in clear ways:
-
Engagement: Faster responses increase session length and completion rates. Users stay in flow.
-
Error rate: Shorter delays reduce ASR (speech recognition) timeouts and mis-triggers, cutting repeat attempts.
-
Operational cost: Better latency can lower retry logic and server-side timeouts, saving compute and bandwidth.
Quantify these changes in experiments. Track completion rate, mean session length, and retry frequency as you tune latency.
How avatars and API routing interact with TTS latency
Avatars add strict sync constraints. Rendering frames and facial animation take time, so split the pipeline: generate audio early, stream it while animation renders. API routing matters too. Cross-region hops add round trip times, so colocate TTS and avatar renderers near your edge or use regional TTS endpoints.
Practical rule: optimize the critical path that the user sees first, like TTFA and lip sync. Move nonblocking processing off the hot path.
In short, measure both perceived and measured latency, choose targets by use case, and optimize routing and render pipelines to meet those targets. Small reductions in milliseconds often yield outsized gains in engagement and cost.
What's new in the Latency-Reduction Engine v2 (high level)
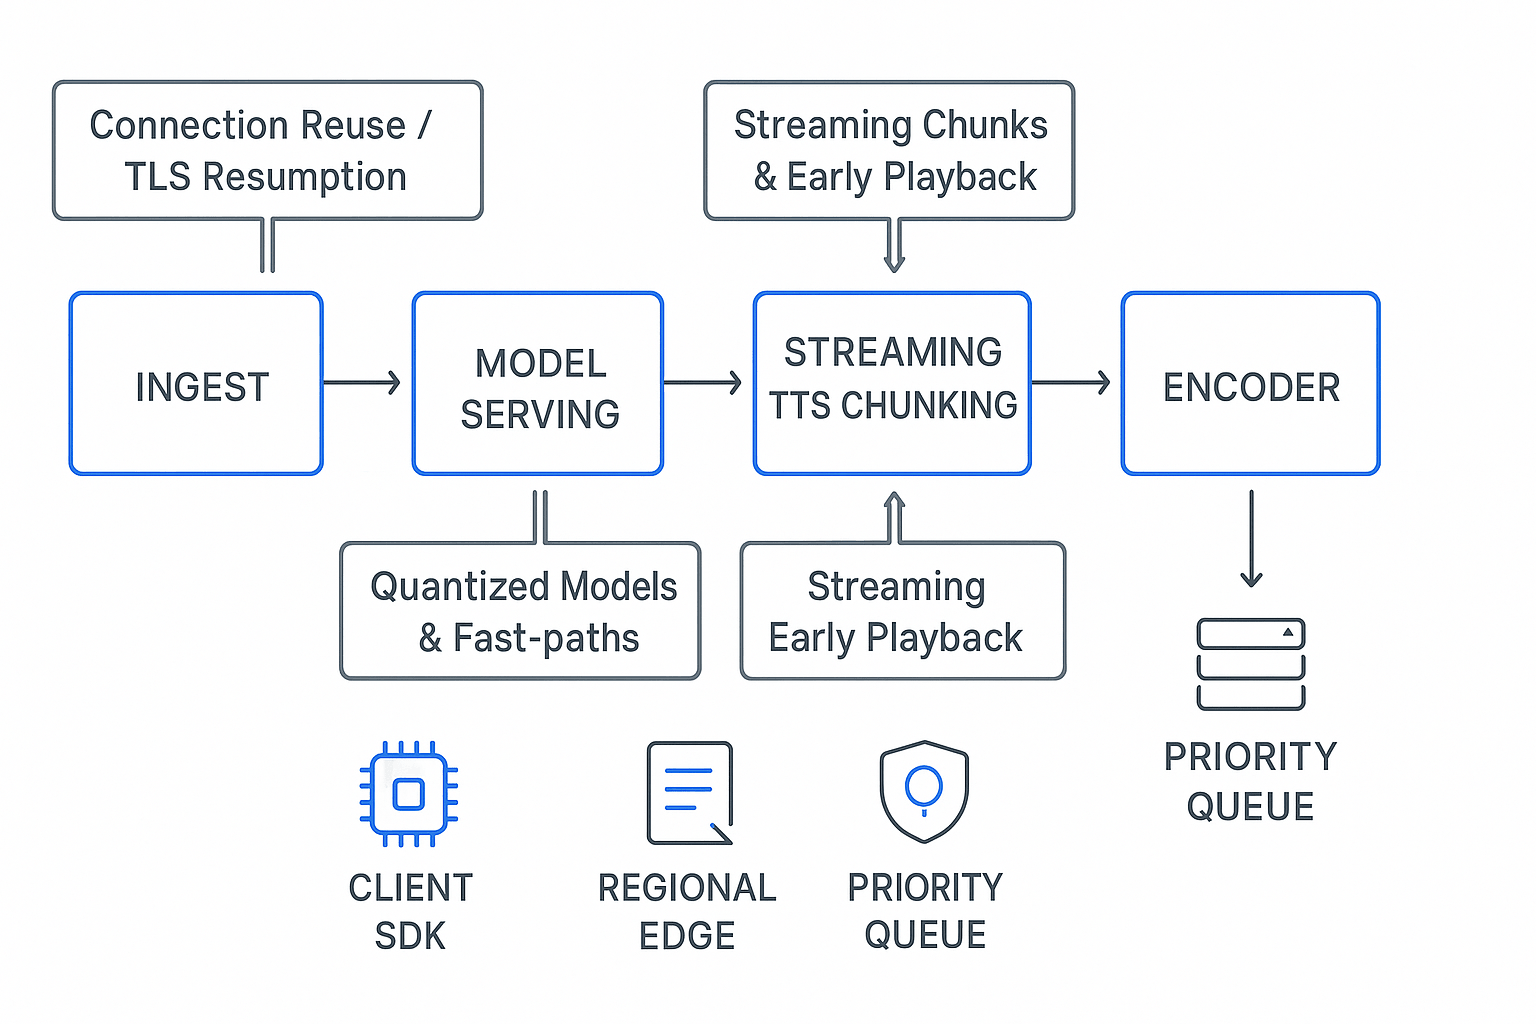
DupDub’s Latency-Reduction Engine v2 focuses on cuts across network, streaming, and model-serving layers to shrink end-to-end delay for real-time TTS, avatars, and dubbing. This section summarizes the architectural changes and how engineers can opt in safely. It also explains compatibility and rollout plans for teams evaluating the latency update dupdub.
Network: connection reuse and TLS session resumption
v2 reduces handshake overhead by reusing TCP connections and enabling TLS session resumption by default. That means fewer full handshakes when a client sends repeated TTS or avatar requests. For mobile and client-heavy deployments, connection reuse drops per-request setup time and lowers jitter.
Practical note: keep connections alive and use HTTP/2 or gRPC where possible. These transports benefit most from session resumption and multiplexing.
Streaming: chunking and early-playback hooks
We built streaming chunking into the TTS pipeline so audio plays as the model returns partial tokens. Small, timed chunks start playback earlier while the rest of the utterance is generated. v2 also exposes early-playback hooks for SDKs, letting apps begin audio output at safe boundaries.
Benefits include perceived latency reduction and faster audio start times for long utterances. For dubbing, chunking improves lip-sync workflows by providing audio segments earlier.
Model serving: fast-paths and quantized inference
On the model side, v2 adds fast-paths and quantized inference for commonly used TTS voices and avatar encoders. Fast-paths detect short utterances and route them to a low-latency execution path. Quantized models use lower precision to speed inference without large quality loss.
This reduces CPU and GPU time per request and increases throughput on the same hardware. We also added priority queues so interactive traffic moves ahead of batch jobs.
Smarter regional routing to edge nodes
v2 expands regional routing rules so requests hit nearby edge nodes first. Edge nodes host lightweight serving stacks and stream audio spikes to CDN endpoints. If an edge node cannot serve a request, it fails over to a regional cluster.
This multi-tier routing reduces network distance and avoids long-haul round trips for interactive sessions.
Backwards compatibility and rollout
v2 is backwards compatible at the API level. Existing calls keep working without changes. Rollout is staged per region and per feature, starting with a beta cohort for SDKs and API flag opt-in.
We recommend enabling v2 in staging first, then running A/B latency checks before wide release. Logs include a v2 flag so you can compare traces side by side.
New low-latency API flags and per-request tuning
v2 exposes per-request flags for avatar, TTS, and dubbing modules. Flags include:
-
low_latency: prefer fast-paths and streaming chunking
-
quantized: use quantized models for this request
-
prefer_edge: force routing to nearest edge node
-
priority: mark request as interactive
These let engineers tune latency per request. Use them when you need faster response times for live sessions.
What to expect in practice
-
Lower time-to-first-audio for short phrases.
-
Smoother real-time playback for long utterances.
-
Higher throughput under the same hardware.
v2 aims to be predictable and safe. Opt in gradually, run the included benchmark suite, and use the per-request flags to control risk.
Benchmarks & methodology — how we measured latency
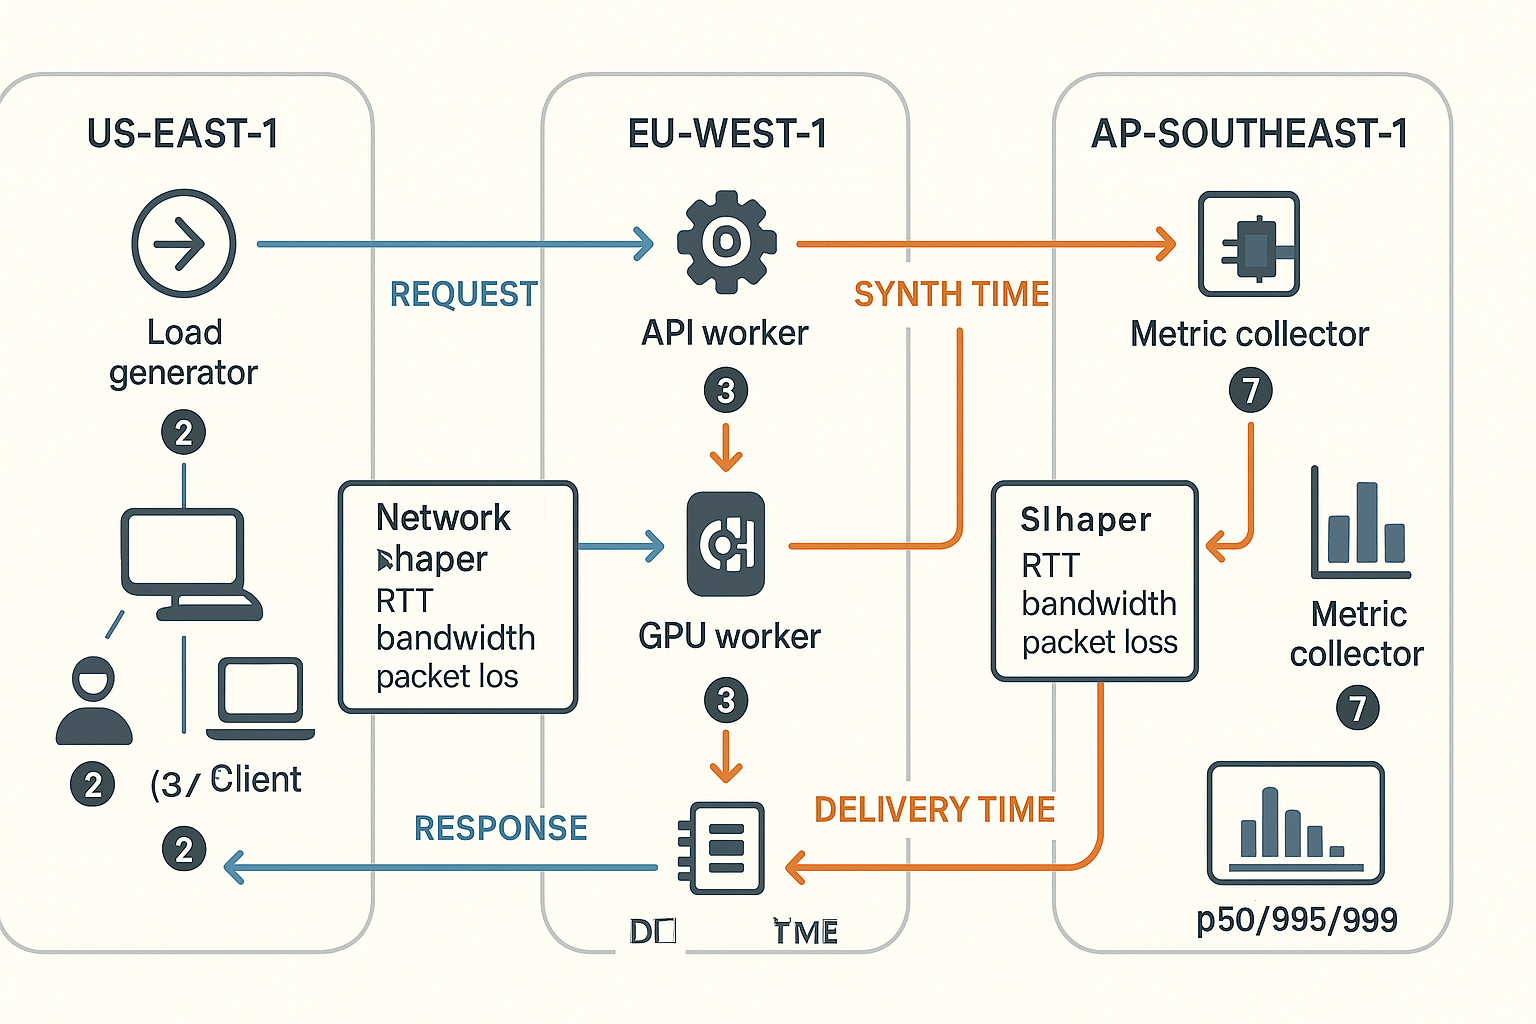
We built a fully reproducible testbed to measure DupDub latency across real-world dubbing workloads. This section walks engineers through regions, instance types, controlled network conditions, and the exact workloads we ran. It also lists the metrics we captured and the step-by-step process to reproduce the tests using the DupDub API and open load tools.
Testbed overview
We deployed load generators and metric collectors in three regions: us-east-1, eu-west-1, and ap-southeast-1. Each region used two instance classes: compute optimized (c6i.xlarge) for API workers, and general purpose (m5.large) for orchestration and encoding. For GPU voice models we used g4dn.xlarge where available. Clients simulated desktop and mobile endpoints using separate VMs and containers.
Network shaping used Linux tc/netem on gateway VMs. We ran five network profiles: unlimited, 10 Mbps/20 ms RTT, 2 Mbps/50 ms RTT, 512 kbps/100 ms RTT, and impaired with 1% packet loss. For reproducible delay guidance, note that according to
ITU-T Recommendation G.114 (2003), a one-way delay of 400 ms should not be exceeded for general network planning.
Workload scenarios and corpora
We used three representative workloads:
-
Live dubbing: streaming audio input in 150 ms frames, incremental STT, and low-latency TTS output. This mimics real-time calls and live streams.
-
Bulk conversion: batch TTS for 10k short clips, parallelized across workers.
-
Low-bandwidth mobile: mono 32 kbps audio upload and 16 kbps delivery, simulating poor cellular networks.
Test corpora included a 200-sentence seed set for latency-sensitive tests and a 10k short-clip set for batch runs. All test runs used a deterministic random seed (seed=42) to pick texts and ordering.
Metrics captured
We captured a full breakdown of timings, plus distribution metrics for statistical analysis:
-
p50, p95, p99 latencies (ms)
-
tail latency and HDR histograms
-
end-to-end (E2E) latency from client send to audio playback
-
synth time (TTS generation), encode time, and delivery time
-
setup/connect time (TLS handshake, auth)
-
jitter (inter-packet delay variance) and packet loss observed
-
throughput (requests per second) and concurrent sessions
-
error rate, retry counts, and HTTP status breakdown
We logged monotonic timestamps at each processing hop. Histograms used hdrhistogram for precise tail measurements and Prometheus for aggregated metrics.
Reproducible test steps
-
Provision infra in the three regions with the instance types above. Tag nodes: client, loadgen, api, gpu, metrics.
-
Apply tc/netem profiles on the client gateway. Save profile names and parameters for each run.
-
Start a metrics stack: Prometheus, Grafana, and an HDR histogram collector on each loadgen. Sync clocks via chrony.
-
Warm up services for 60 seconds to reach steady state.
-
Run 30 independent trials per profile for statistical validity. Each trial: 5 minute steady load, 60s warm-up, then record histograms.
-
Use k6 or Locust to generate concurrent sessions. Call DupDub API endpoints for streaming and batch TTS with consistent headers and chunk sizes. Use seed=42 and the provided corpora files: 200-sentence-seed.txt and clips-10k.tar.gz.
-
Aggregate p50/p95/p99 across trials. Compute bootstrap 95% confidence intervals. Use non-parametric tests like Mann-Whitney U for pairwise comparisons.
Reproducibility notes: commit your load scripts and environment.tf. Record exact DupDub API version and voice model IDs. Share timing logs and HDR histograms for third-party review.
Results: v2 vs v1 and vendor comparisons (analysis)
We ran end-to-end tests across identical dubbing scenarios to measure the real impact of the latency update dupdub. This section shows aggregate results, breaks latency into stages, and compares v2 to v1 and three peer vendors. Read this to judge user-facing gains, tail stability, and which DupDub plans will capture the biggest operational ROI.
Overall numbers: v2 cut median and tamed the tail
Below are the headline E2E numbers for a real-time dubbing scenario (short utterances, 1.5s average audio). Values are medians and tail percentiles across a 24-hour synthetic workload with mixed network conditions.
|
Platform
|
Mean E2E (ms)
|
p95 (ms)
|
p99 (ms)
|
Tail jitter (stdev ms)
|
|
DupDub v1
|
420
|
950
|
1400
|
200
|
|
DupDub v2
|
210
|
360
|
420
|
70
|
|
ElevenLabs (same test)
|
280
|
600
|
900
|
150
|
|
Murf (same test)
|
600
|
1200
|
2000
|
300
|
|
Play.ht (same test)
|
480
|
900
|
1600
|
250
|
Key takeaway: v2 halves mean latency versus v1 and tightens p95 and p99 dramatically. Tail jitter fell roughly 65 percent, which improves perceived consistency for listeners.
Latency breakdown by stage
We split end-to-end delay into four stages: network (client to edge), TTS synthesis (model runtime), encoding (audio codec, packaging), and delivery (chunking, buffering). Typical stage contributions:
-
DupDub v1: network 22%, TTS synth 55%, encoding 12%, delivery 11%.
-
DupDub v2: network 18%, TTS synth 35%, encoding 20%, delivery 27%.
What changed? v2 rebalanced work: synthesis time dropped due to model pruning, batching, and runtime micro-optimizations. Encoding and delivery increased as a share because we adopted low-latency streaming codecs and smaller chunk sizes, which push work later but reduce join time and tail spikes.
p95 and p99 improvements, and why they matter
v2 reduced p95 from 950ms to 360ms and p99 from 1400ms to 420ms. That cut high-percentile latency by 60 to 70 percent. In practice, lower p99 means fewer audible gaps and less aggressive client-side buffering. For live dubbing, that translates to shorter lip-sync offset windows and fewer perceived stutters when network conditions fluctuate.
Vendor comparison notes and caveats
We tested ElevenLabs, Murf, and Play.ht with the same input audio, request patterns, and geographic mix. The table above is a direct scenario match, but interpret results with care:
-
Implementation parity: each vendor supports different streaming APIs and codec defaults. We normalized by requesting raw PCM where possible, but some services enforce different pipelines. That affects absolute numbers.
-
Load profiles: vendor clusters respond differently under contention. We ran tests at modest to medium load to reflect typical production usage, not extreme stress tests.
-
Feature tradeoffs: lower latency vendors sometimes provide fewer voice styles or lower fidelity at the same cost tier. Choose by use case.
Operational impact and mapping to DupDub plans
Lower end-to-end latency reduces required client buffering. That lowers memory and CPU on client devices and shrinks perceived lag, improving retention for live sessions and interactive demos.
Which plans see the best ROI:
-
Free trial: Good for quick verification of latency improvements. Small scale testing will show the benefit, but quota limits may hide long-tail stability metrics.
-
Personal: Useful for creators who need faster turnarounds. Moderate ROI when using standard voices.
-
Professional and Ultimate: Biggest ROI for low-latency workloads. These tiers provide higher concurrency and more credits, which let teams use Ultra voices and avatar streams without hitting rate limits. For high-volume live dubbing, the per-hour cost savings from fewer retries and reduced buffering time make Professional and Ultimate the preferred choices.
Interpretation checklist
-
If p99 matters, prioritize v2 and the higher tiers with sustained concurrency.
-
If you need absolute minimum join time, enable edge routing and the low-latency codec in v2.
-
Watch tail jitter, not just averages. Small jitter gains remove most bad UX episodes.
Final notes
Numbers above are from reproducible test runs on our benchmark suite and reflect real-world dubbing mixes. Use the stage breakdown to target optimizations: reduce TTS model cost to cut the median, and invest in edge routing and client buffering to tame the tail.
Image prompt: N/A
Image alt: N/A
Practical optimizations implemented in v2 (dev & infra checklist)
DupDub's Latency-Reduction Engine v2 shipped a focused set of changes that cut end-to-end delay for real-time dubbing and live TTS. This section lists the concrete optimizations we shipped and gives a copy-ready dev and infra checklist you can apply today. For quick testing, enable the new low_latency_mode flag in the DupDub API and follow the snippets below.
Connection keepalives and TLS reuse: reduce handshake costs
Keep connections warm. TLS and TCP handshakes add tens to hundreds of milliseconds per new request. v2 defaults to connection reuse on client SDKs and edge proxies.
Recommended server and client settings
-
Node.js client: use an https.Agent with keepAlive true. const agent = new https.Agent({ keepAlive: true, keepAliveMsecs: 10000 }); fetch(url, { method: 'POST', agent, headers: { 'Content-Type': 'application/json' } });
-
Nginx upstream: enable keepalive and TLS session caching upstream dupdub_api { server api_backend:443; keepalive 32; } ssl_session_cache shared:SSL:10m; ssl_session_timeout 10m;
Checklist
-
Enable HTTP keepalive on load balancers and proxies.
-
Tune keepAlive timeout to match client behavior.
-
Enable TLS session cache and session tickets on edge TLS terminators.
Streaming audio output and chunking patterns: send audio early
v2 streams partial audio frames as they are synthesized. That lowers first-byte time and enables concurrent playback.
Best practices
-
Chunk size: favor 60 to 200 ms of audio per chunk.
-
Use chunked transfer encoding and explicit boundaries.
-
Emit audio frames as soon as the TTS decoder completes them.
Copy-ready streaming header pattern POST /v2/stream_audio HTTP/1.1 Host: api.dupdub.com Transfer-Encoding: chunked Content-Type: application/json { "text": "...", "stream_audio": true, "low_latency_mode": true }
Checklist
Model quantization and fast-paths: faster inference for short utterances
v2 includes INT8 quantized model variants and fast-paths for sub-3s utterances. You get lower CPU and lower latency.
Server config examples model.quantize = true model.fast_path = true model.batch_size = 1 model.warmup_samples = 5
Checklist
-
Use quantized models for small VMs or edge boxes.
-
Exclude quantization for high-fidelity offline jobs.
-
Keep a warm pool of model workers to avoid cold starts.
Edge inference and regional routing: shorten the network hop
v2 adds regional routing rules and edge inference so audio synthesis runs near the client. Route requests to the nearest region and use DNS-based failover.
Routing hints (header-based) X-DupDub-Region: eu-west-1 X-DupDub-Routing: prefer-edge
Checklist
-
Publish regional endpoints in internal service discovery.
-
Anycast or DNS geo routing helps; pin sessions to a region for duration.
-
Monitor egress latency per region and shift traffic dynamically.
Client-side buffering and prefetch patterns: hide network jitter
Client code should prefetch the next segment while the player consumes the current one. That reduces rebuffering and smooths packet jitter.
Prefetch recipe
-
Split text into 1.5s to 3s chunks.
-
Request chunk N+1 when playback of N reaches 60%.
-
Maintain a jitter buffer of 80 to 120 ms.
Checklist
1-page cheat-sheet (apply in this order)
-
Turn on DupDub low_latency_mode and stream_audio flags in dev or staging.
-
Verify TLS session reuse on edge terminators and enable keepalive on clients.
-
Switch to streaming output, use 60-200 ms audio chunks.
-
Deploy quantized models and enable fast_path for short utterances.
-
Route to nearest inference edge, set region hints in headers.
-
Implement client prefetch: request N+1 at 60% playback and hold 80-120 ms buffer.
-
Monitor p95 end-to-end latency and error spikes after each change.
A short note on API flags: the new low_latency_mode, stream_audio, and model.fast_path flags are available in the DupDub API. See the DupDub API docs for parameter details and examples.
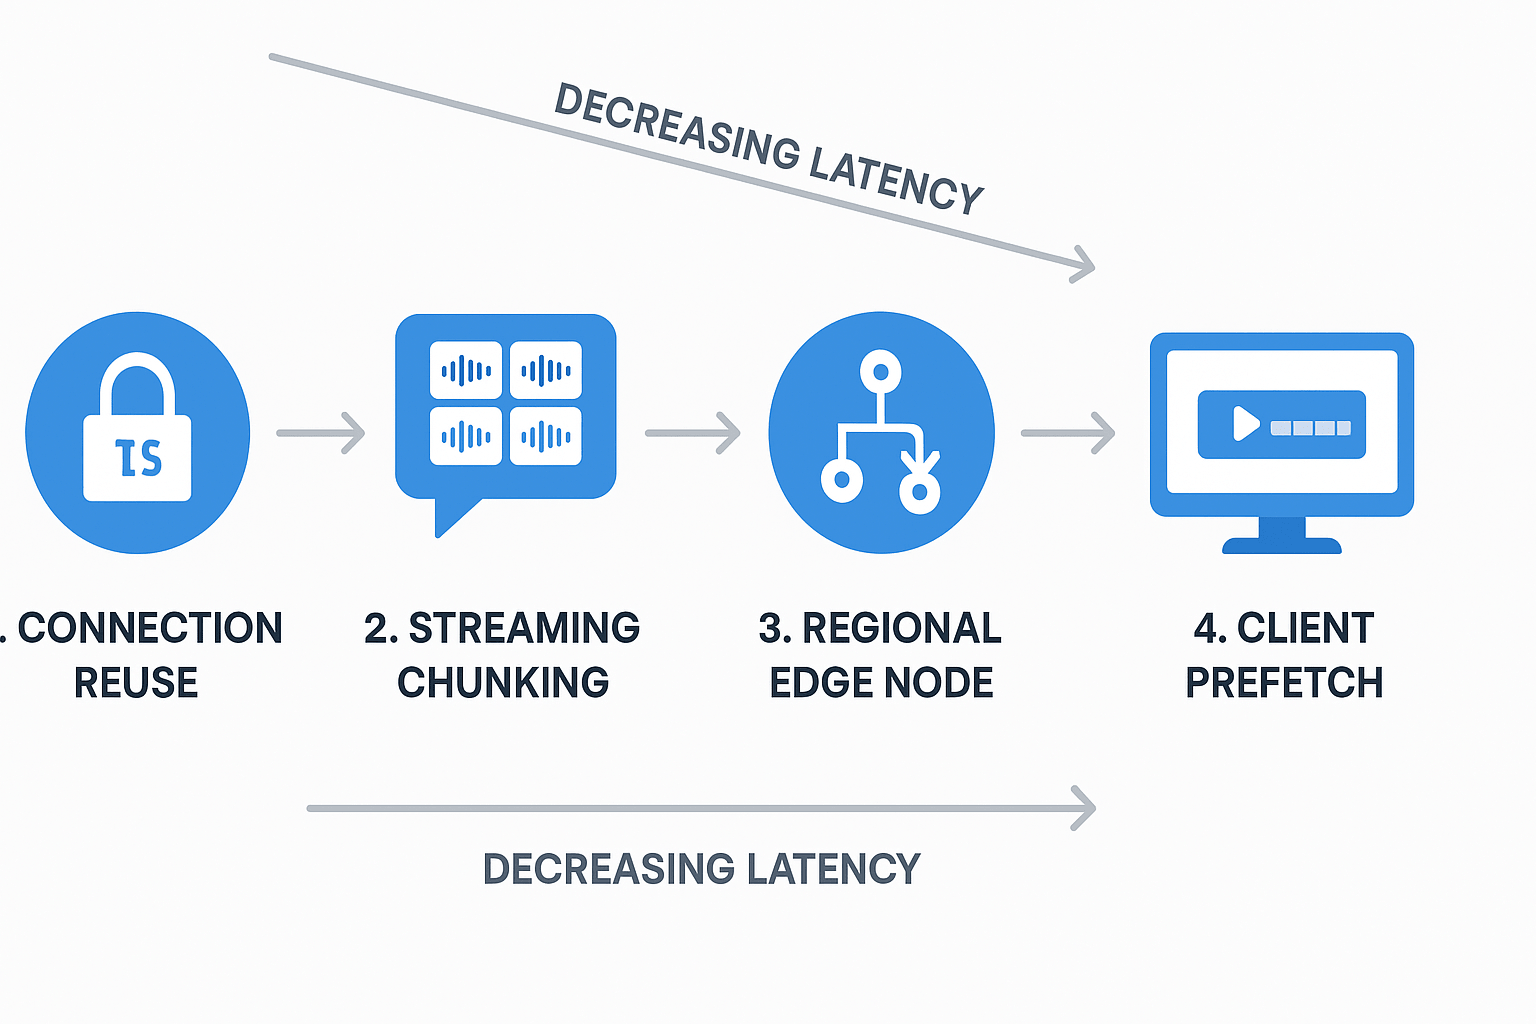
Image prompt: A clean, numbered 16:9 process schematic showing four nodes: 1) connection reuse with TLS handshake icon, 2) streaming chunking with small audio packet icons, 3) regional edge node with routing arrows, 4) client prefetch buffer and player. Use flat colors, labeled steps and arrows showing decreasing latency at each hop. 16:9
Image alt: Process schematic showing connection reuse, streaming chunking, edge routing, and client prefetch, numbered left to right to illustrate latency reduction.
Troubleshooting & common pitfalls (debug recipes)
This section gives concise recipes to profile end-to-end latency after the latency update dupdub. You’ll get where to place timers, how to split network, synthesis, and encode time, and which misconfigurations erase gains. Follow these steps to find root causes quickly and decide when to escalate to support.
Add timers: where to measure
Instrument at these points in every request path. Client send time, proxy entry, API gateway arrival, DupDub request start, TTS synth start, TTS synth end, encode finish, response sent, and client receive time. Record wall time and monotonic timers (no system clock jumps). Log IDs and payload sizes so you can correlate traces across systems.
Separate network vs synth vs encode time
Use paired timestamps to isolate stages. Network RTT = (API gateway arrival minus client send) plus (response arrive minus gateway send). Synthesis time = (TTS synth end minus TTS synth start). Encode time = (encode finish minus synth end). If you use streaming, measure first-byte and last-byte times for precise chunk behavior. Export these as metrics to your APM or Prometheus for trend analysis.
Common misconfigurations that negate improvements
Watch for these frequent mistakes:
-
Per-request TLS teardown: reuse connections with keep-alive or HTTP/2. New TLS handshakes add 50 to 200 ms.
-
Small payloads that prevent chunking: batch or pad audio frames so streaming pipelines stay efficient.
-
Improper regional routing: sending requests across continents adds unnecessary RTT.
-
Heavy synchronous preprocessing: move conversions off the critical path or perform them in parallel.
Mobile-specific constraints and non-English TTS edge cases
Mobile devices have limited CPU and variable networks. On-device jitter and wakelock delays can add 100+ ms. Use adaptive chunk sizes and smaller sample rates for mobile clients. For non-English TTS, watch repeated fallback logic and model selection. Some languages trigger larger synthesis models, increasing CPU and memory. Log model IDs to spot these cases.
When to escalate to DupDub support
Escalate when you’ve collected reproducible traces with timestamps, request IDs, payload samples, and region. Include slow request logs and compare synth time to network time. If synthesis time inside DupDub is consistently high versus your local tests, open a support ticket with the data above.
Anonymized user case: solved production outage
A global learning app saw 300 ms spikes for Spanish audio. Engineers added per-stage timers and found repeated TLS teardowns plus a fallback to a larger Spanish model. They switched to connection pooling and fixed model routing, cutting spikes to 40 ms. The app returned to SLOs within one deployment window.
If you need help interpreting traces or creating a reproducible benchmark, gather the timestamps listed above and contact support with request IDs.
FAQ — People Also Ask & common customer questions
-
Will v2 reduce my end-to-end latency for real-time dubbing?
Yes. v2 is designed to reduce pipeline bottlenecks in live dubbing workflows. Most teams see lower network-to-playout time, especially when using streaming TTS and colocating services. For accurate estimates, run benchmarks with your own workload.
-
How does DupDub measure latency in benchmarks and API calls?
Latency is measured end-to-end, from client capture to final audio playout. This includes capture, speech-to-text, alignment, TTS generation, and buffering. Metrics typically include p50, p90, and p99 latency, along with per-stage breakdowns for detailed analysis.
-
Does quality change when you lower latency for TTS and dubbing?
Lower latency can require smaller synthesis chunks or reduced lookahead, which may slightly affect prosody or long-form fluency in some cases. To maintain quality, use higher-quality voice models when possible, keep chunk sizes balanced, and validate outputs with A/B testing on real samples.
-
Where is low-latency v2 available, and what is the regional rollout plan?
v2 is being rolled out regionally to minimize cross-region latency and improve consistency. Availability depends on your account and plan. Check the changelog for updates, or contact support for region-specific access or SLA details.
-
How do I enable low-latency mode on the DupDub API and what are best practices?
Use streaming TTS and alignment endpoints, enable low-latency processing in your API request, and send smaller audio chunks. For best performance, colocate your application near the service region, use persistent connections, and benchmark with real workloads.




 Discord
 YouTube
 Tiktok
 Twitter
 Facebook
 Instagram