


TL;DR: What you'll learn and the quick takeaways
-
Instrument request volume, success rate, latency, cost per minute, and voice and locale usage.
-
Send structured event payloads to analytics endpoints, retain raw events and aggregated stores, and enable batching.
-
Alert on error rate, p99 latency, and sudden cost or usage spikes to catch regressions fast.
What is DupDub Analytics and why TTS analytics matter
What DupDub Analytics collects and how
Why teams care: business outcomes
-
model_id, token_count, duration_seconds -> cost and budget alerts
-
voice_id, quality_score, timestamp -> voice consistency and regression checks
-
latency_ms, error_code -> SLOs (service level objectives) and incident response
Key TTS metrics to track (and why each matters)
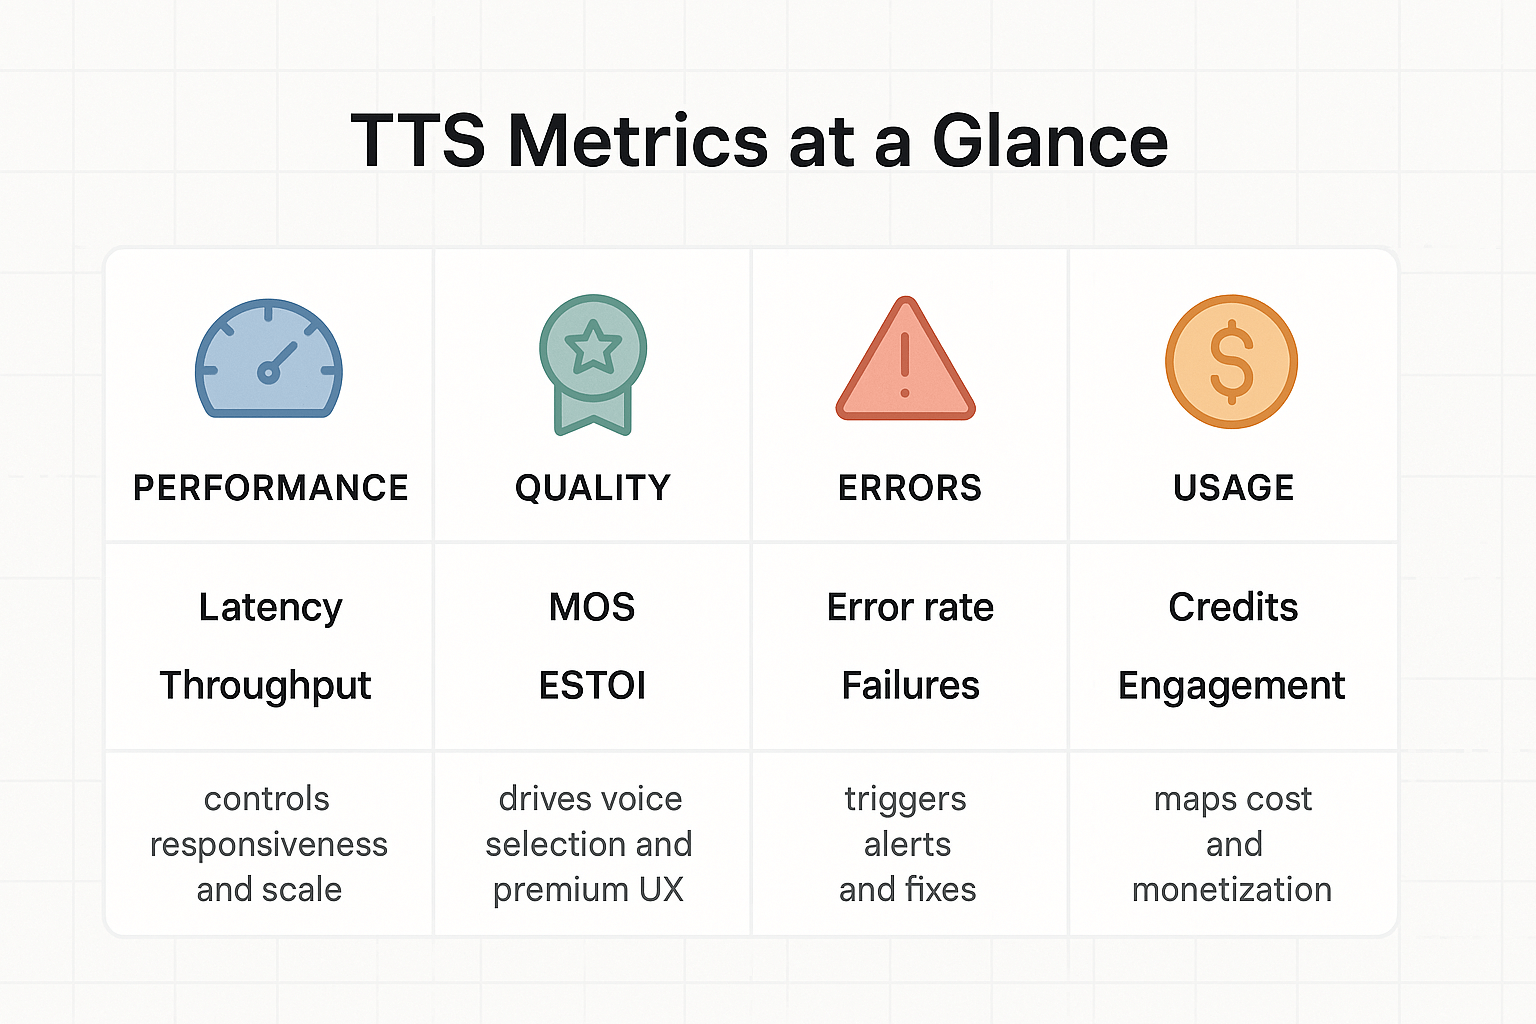
Performance: latency and throughput
-
Latency (ms per request). Lower latency improves user experience for live features and interactive agents. Use latency to set SLOs and pick faster voices or smaller models when speed matters.
-
Throughput (requests per minute or concurrent streams). Throughput shows capacity needs. Scale instances or switch to batch rendering when throughput peaks.
Quality: MOS and audio-quality proxies
Reliability: error rates and failures
Usage and cost: attribution and engagement
-
Business growth: prioritize throughput and cost per minute.
-
Premium UX: prioritize MOS and low latency.
-
Reliability focus: prioritize error rates and SLOs.
Setting up DupDub Analytics endpoints — step-by-step
Prerequisites: account, keys, and roles
-
Create a DupDub account and activate API access. 2. Generate an API key scoped to analytics and to the TTS or dubbing modules you use. 3. Ensure the key’s role permits event ingestion and project-level read access for verification. 4. Note your project_id and environment (prod or test).
Available endpoints and event types
-
usage.event: credits consumed, model id, voice id, duration, file size
-
quality.event: MOS (mean opinion score), transcription error rate, latency
-
system.event: infra errors, rate-limit notices
Server example: send a usage event and verify
Client-side example: browser reporter
Batching, retries, and rate limits
-
Batch small events up to 100 per request, or 256 KB per batch. - Use exponential backoff for 429 and 5xx responses, with jitter. - Add an idempotency key per event or batch to prevent duplicates. - Throttle client-side emission to avoid hitting rate limits during bursty uploads.
Best practices
-
Include model, voice, locale, and request_id in every event. - Tag events with environment (test/prod) and project_id. - Keep PII out of analytics payloads. - Store raw event_id server-side for later reconciliation.
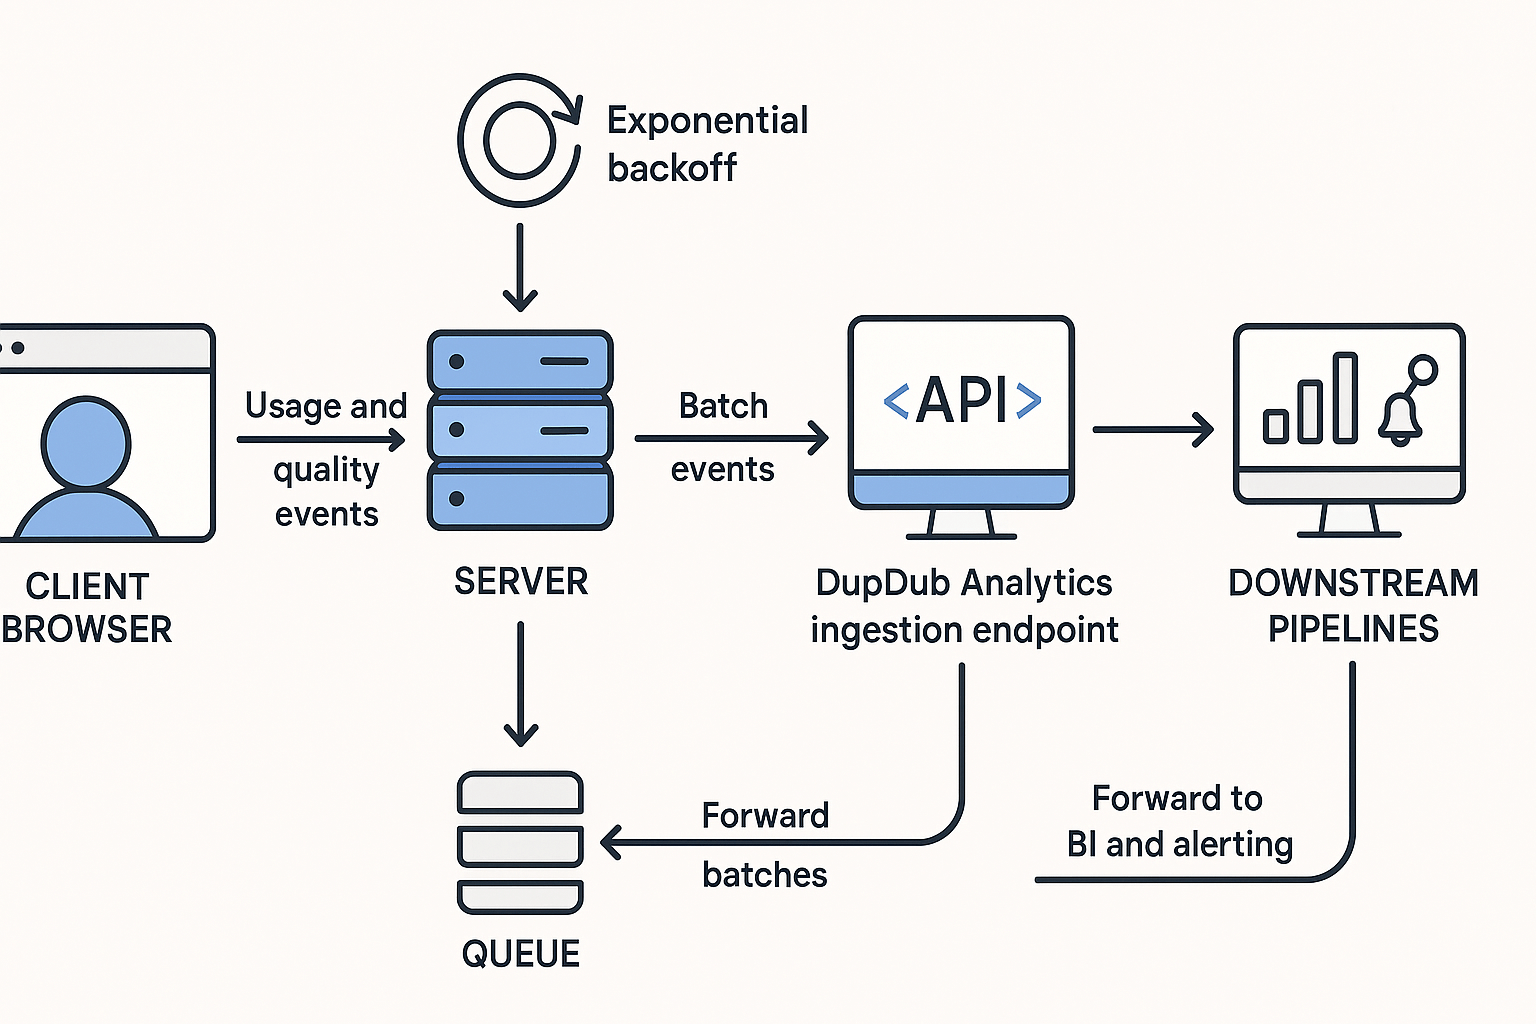
Integration patterns & automation: where to send analytics
Client-side vs server-side tracking: pick based on trust and latency
Use webhooks for real-time workflows
POST /webhook accepts JSON, verifies a signature header, then enqueues to a job queue.ETL pipelines for analytics and long-term storage
Tagging and metadata for multi-tenant setups
tenant_id, project_id, env (prod/staging), voice_model, and locale. Store both raw and normalized fields. Keep PII out of event payloads and use hashed identifiers if needed.Short example pipeline
-
DupDub webhooks -> verify signature, push to Kafka topic
dupdub.raw_events. -
Stream processor enriches events with
tenant_idand normalizes timestamps. -
Write enriched JSON to S3 partitioned by
date=YYYY-MM-DD/tenant_id. -
Daily Glue/DBT job transforms S3 into warehouse table
analytics.tts_usage.
fetch('/api/ingest', {method:'POST', body:JSON.stringify(event)}). On the consumer side, schedule daily transforms to generate KPIs.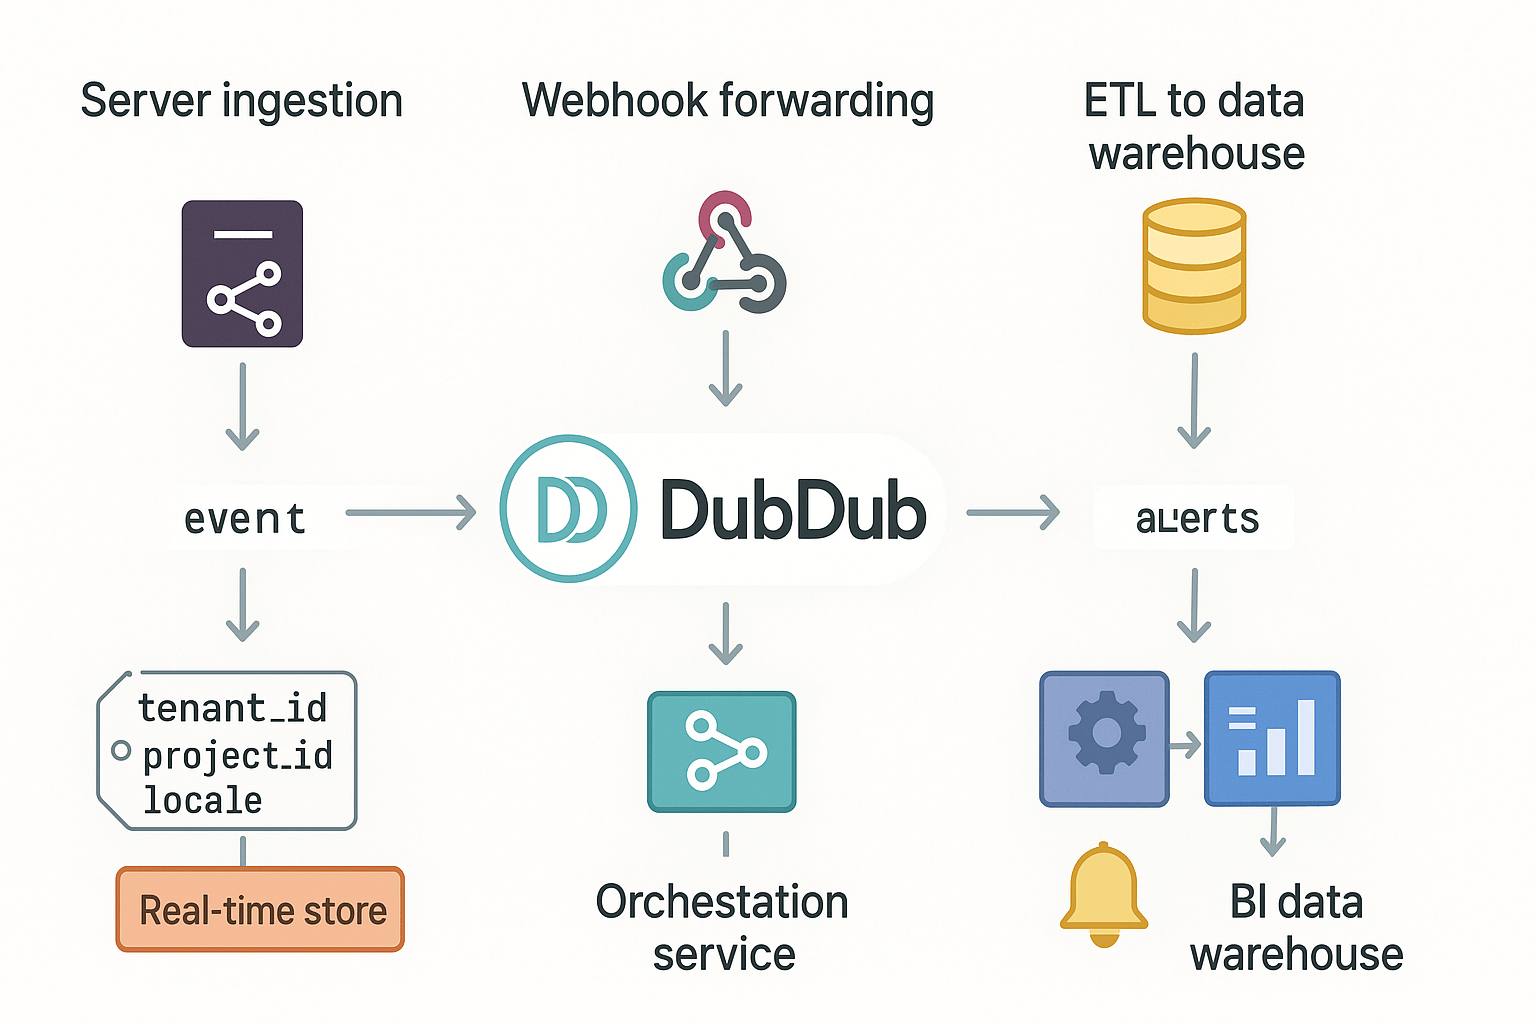
Monitoring, visualization & alerting for TTS KPIs
Design dashboards for signal and action
Recommended KPIs (and why they matter)
-
p95 latency: shows worst-case user wait, drive SLAs and UX fixes.
-
Error rate (percent): tracks synthesis failures and regressions quickly.
-
SLO burn rate: indicates how fast you’re consuming allowed error/latency budget.
-
Monthly active voices (MAV): signals adoption, billing, and voice popularity.
-
Cost per minute and cost per request: links usage to spend and optimization.
Example alert rules
-
p95 latency > 800 ms for 5 minutes, page on-call.
-
Error rate > 1% for 3 minutes, create incident and mute noisy sources.
-
SLO burn rate > 2 for 10 minutes, escalate to on-call and rollback risky deploys.
-
Monthly cost forecast exceeds budget by 10%, notify finance and infra.
Realtime stacks and long-term BI
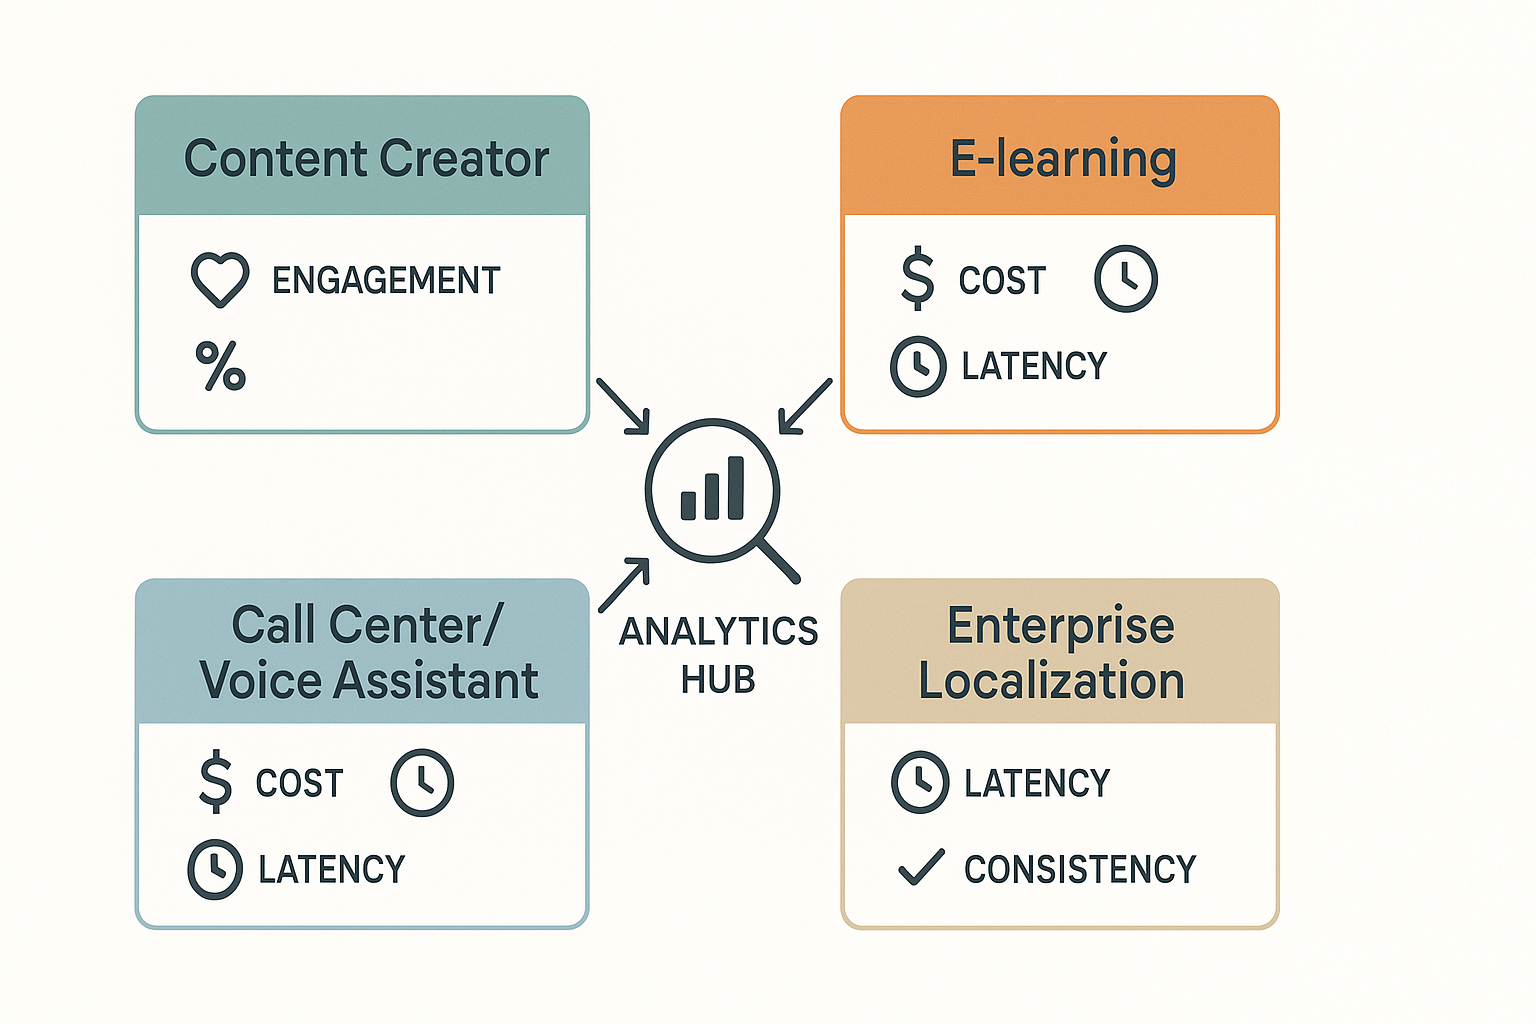
Use cases & recommended analytics configs by ICP
Content creators: engagement first, cost second
-
Priority metrics: Play-through rate, Completion rate, Cost per minute, Voice-match error (per clip)
-
How DupDub helps: Voice cloning and many ready voices cut A/B test time, so you can log variant IDs and compare engagement fast.
E-learning platforms: accuracy, retention, and accessibility
-
Priority metrics: Segment retention, Repeat listens per lesson, Caption sync accuracy, Cost per learner
-
How DupDub helps: Multilingual TTS and subtitle alignment mean you can instrument language tags and compare retention across locales.
Call centers and voice assistants: latency and reliability
-
Priority metrics: 95th percentile latency, Error rate, Fallback invocation rate, MOS proxies
-
How DupDub helps: Fast API endpoints and predictable pricing let you tag requests with priority and route heavy traffic to cached voices.
Enterprise localization teams: scale, quality, and compliance
-
Priority metrics: Throughput, Voice consistency, Cost per locale, Audit log completeness
-
How DupDub helps: Centralized voice cloning and avatar policies let you standardize voice IDs and simplify event schemas.
Interpreting results, known limitations and bias considerations
Common pitfalls
-
Human rater bias: small rating panels often prefer familiar accents, speakers, or content, skewing preference signals.
-
Dataset skew: offline test sets or synthetic scripts rarely reflect real production traffic and edge cases.
-
Proxy-metric limitations: objective scores like WER or MOS (mean opinion score) miss prosody, naturalness, and cultural appropriateness.
Mitigation strategies
-
Stratified sampling: include languages, demographics, platforms, and content genres in test cohorts.
-
A/B testing with statistical power: run randomized experiments and predefine primary KPIs and success thresholds.
-
Periodic human-in-the-loop evaluation: run blind preference tests and targeted audits on flagged segments.
-
Combine automated proxies with behavioral signals: use engagement, replay rates, and edit frequency to validate quality.
-
Monitor distribution shifts and alert on demographic or latency changes.
Expert commentary on tradeoffs
Side-by-side comparison & decision guide
Comparison: telemetry and integration
|
Feature
|
DupDub
|
Typical competitor
|
|
Telemetry depth (events)
|
High: per-request, per-asset, voice model
|
Varies: often session-level only
|
|
Event granularity
|
Millisecond timestamps, voice/style tags
|
Coarser, fewer contextual fields
|
|
Real-time endpoints
|
Webhooks + push/stream options
|
Webhooks common, streams rare
|
|
Export formats
|
JSON, CSV, webhook payloads
|
JSON, limited exports
|
|
SDKs & client libs
|
Multi-platform helpers, clear schemas
|
Often REST-only, fewer SDKs
|
|
Integration friendliness
|
Schema-first, sample payloads, onboarding docs
|
Mixed, more custom work
|
Decision checklist: map goals to metrics and first endpoints
-
Track cost and usage: prioritize audio_seconds, credits_used, model_id. Implement /analytics/usage and /events/usage first.
-
Measure quality and retries: log error_code, latency_ms, request_payload_id. Add /analytics/errors and /events/latency.
-
Optimize UX and conversions: capture play_rate, completion_rate, user_id. Add /events/playback and /events/conversion.
-
Compliance and provenance: store speaker_id, locale, transcript_checksum. Enable /analytics/audit logs.
-
Real-time automation: subscribe to webhooks for failures and completions, then forward to your monitoring pipeline.
FAQ — common questions about DupDub analytics endpoints
-
How do I access logs and raw TTS analytics events?
You can pull raw events from the analytics endpoints in the DupDub API or stream them via webhooks. Events include request metadata, audio duration, voice ID, and latency. For bulk needs, export or replay endpoints let you download NDJSON logs for offline analysis. Visit the DupDub API docs to see exact payloads and example queries.
-
What are the default data retention and privacy settings for analytics?
DupDub retains event logs for a default window to balance usefulness and privacy. Recorded voice data used for cloning is locked to the original speaker and processed encrypted. If you need a shorter retention window or stricter controls, request custom retention via the dashboard or contact sales for enterprise options.
-
How will high-frequency telemetry affect my costs and performance?
High-frequency telemetry increases storage, ingest, and processing costs, and may hit rate limits. Use sampling, batching, or aggregated counters to lower cost. If you expect heavy streams, plan for higher tiers or a pay-as-you-go credit plan.
-
How do I troubleshoot common webhook and integration errors for analytics endpoints?
Check signatures and timestamps first to rule out auth errors. Inspect HTTP error codes, JSON schema mismatches, timeouts, and retry behavior. Use replay and local mock servers to reproduce issues, and verify you registered webhook keys in the dashboard.
-
Where do I get API keys, webhook keys, docs, or support?
Create an account to get API and webhook keys in the DupDub dashboard. For docs, examples, or enterprise questions, consult the API docs or contact sales. Subscribe for product and API updates to stay informed. Start a 3-day free trial to test analytics in your workflow.

 Discord
 YouTube
 Tiktok
 Twitter
 Facebook
 Instagram