
How to Measure and Improve Average Listening Time per Session for TTS Content

Apr 02, 2026 13:5013 mins read
Share to
Contents

TL;DR — Key takeaways

ALTS, or Average Listening Time per Session, measures listening time in seconds. This guide shows how to measure ALTS, set benchmarks, and run experiments. It focuses on tts engagement metrics and practical optimizations for audio-driven content.
  • Measure precisely. Define a session and log play, pause, seek, and resume events. Compute ALTS as total listened seconds divided by session count. Exclude background auto-plays.
  • Benchmark by format. Compare podcasts, short-form video, and e-learning to set realistic targets. Report medians and the 25th and 75th percentiles for robust insight.
  • Test to improve. Run A/B tests on voice selection, speaking rate, language localization, and contextual SFX. Prioritize low-cost tests you can scale quickly.

Why Average Listening Time per Session (ALTS) matters for TTS-driven content

Average Listening Time per Session (ALTS) measures how long a listener stays engaged in one listening session. For text-to-speech (TTS) content, ALTS shows whether narration holds attention and transfers meaning. It also functions as a core tts engagement metrics signal product and content teams watch when optimizing audio experiences.

Who benefits most when ALTS rises

  • Content creators: more completed episodes and stronger audience loyalty.
  • Podcasters and short-form video makers: higher retention and recommendation signals.
  • E-learning teams: better course completion and learning outcomes.
  • Product and UX teams: clearer evidence that voice choices improve usability.
  • Localization teams: proof that dubbed or localized voices keep global viewers listening.

Why higher ALTS matters in practice

Longer ALTS ties to better learning outcomes because listeners absorb more material. It raises ad value since advertisers pay more for placements with proven listener attention. It also improves platform retention, because users who listen longer return more often.
Small shifts in ALTS translate to big downstream gains. A five to ten percent rise in session time can lift completion rates and click-throughs for follow-up content. For teams measuring ROI, ALTS is a compact signal that combines quality of voice, pacing, and relevance.
Focus on ALTS and you measure both content and delivery. Tune voice style, pacing, language, and localized phrasing to move the needle. Track ALTS alongside play rate, completion, and repeat sessions to spot what truly keeps listeners engaged.

Core TTS engagement metrics: Definitions and how average listening time per session fits in

Average Listening Time per Session (ALTS) measures the mean minutes or seconds a user listens during a single playback. It’s a practical KPI when you care about in-session engagement, not just whether a file started. For teams tracking tts engagement metrics, ALTS helps diagnose voice, pacing, or localization problems that simple counts miss.

Key metrics and what each tells you

  • Play rate: percent of page views that start audio or video. It shows initial interest.
  • Average Listening Time per Session (ALTS): mean listen time per play session. It reveals depth of attention.
  • Completion rate: percent of plays that reach the end. It shows content length fit and structure.
  • Drop-off points: time-based heatmaps of where users stop listening. They point to friction or boring moments.
  • Repeat listens: users who play the same asset multiple times. They signal usefulness or confusion.
Use ALTS with the others. For example, low play rate and high ALTS means discoverability is the problem. High play rate but low ALTS signals a quality or voice mismatch.

When ALTS is the right KPI

Pick ALTS when you want session-level depth, for example to compare voices, pacing, or localization variants. Completion rate is better for short, fixed-length assets. DAU or MAU matter when you track platform habit, not session quality.
Quick examples that ALTS surfaces
  • Voice mismatch: ALTS drops 30 percent after swapping to an overly robotic TTS voice. That flags voice quality.
  • Localization issue: ALTS falls in a translated version but completion stays steady in the original. That suggests timing or subtitle mismatch.
Measurement design tip: start with clear goals, then map metrics to questions. The Goal Question Metric (GQM) paradigm is considered one of the most effective top-down approaches for measurement programs, as noted by Practitioner-Based Measurement: A Collaborative Approach (2008).

Benchmarks and industry norms for ALTS across content types

Average Listening Time per Session (ALTS) depends on format, intent, and audience. According to The Record: Q4 2025 U.S. Audio Listening Trends, In Q4 2025, U.S. daily audio consumption was 3 hours and 54 minutes, with 63% of this time spent on ad-supported platforms. Use these norms as directional targets, not hard rules, when you design experiments or set KPIs for tts engagement metrics.

Quick benchmarks (practical ranges)

Content type
Typical ALTS (per session)
Notes
Short-form video (social reels, shorts)
15 to 45 seconds
Sessions are snackable, retention matters per 6-15s chunks
Long-form podcasts
18 to 36 minutes
Heavy variance by genre and episode length
E-learning modules (microlearning)
6 to 20 minutes
Short lessons score higher completion rates
Localization and voice quality shift these norms. Native-language audio often raises ALTS by 10% to 40 percent compared to untranslated content. Higher voice naturalness and pacing typically extend sessions, especially for narrative and instructional formats. Platform differences also matter: autoplay on social apps shortens measured sessions, while podcast apps record longer, deliberate listens.

How to interpret these benchmarks

  • Establish a baseline: measure your current ALTS for each format and audience segment first.
  • Segment aggressively: break benchmarks by device, country, language, and traffic source.
  • Use retention curves, not single numbers: look at minute-by-minute dropoff to find friction points.
  • Translate to experiments: pick a realistic lift target, like 10 to 20 percent, and test voice, language, or pacing changes.
Image prompt: N/A
Image alt: N/A

How to measure ALTS: event design, analytics queries, and instrumentation (DupDub-friendly)

Start with a tight event taxonomy and you can compute reliable ALTS. This section shows a simple event design that powers tts engagement metrics, example pseudocode, and SQL and GA4-style queries you can run. It also flags common instrumentation gotchas and where to record DupDub metadata like voice ID, language, and clone.

Define events and session boundaries

Use a small, consistent set of media events: play, pause, seek, stop, buffer_start, buffer_end, and ended. Create session_start and session_end events. Capture timestamps, user_id (if logged in), anon_session_id, device_type, and media_position_ms (current playhead). Record DupDub fields: dupdub_voice_id, dupdub_language, dupdub_clone_id.
Track buffering as its own events, not inferred from paused states. For live or high-concurrency rules, consult IAB Tech Lab's "Live Event Ad Playbook" (2025) for guidance on concurrent streams and session rules.

Pseudocode for event capture

  • On play: emit play with position and DupDub metadata.
  • On pause/stop/ended: emit respective event with final position.
  • On seek: emit old and new position with seek event.
  • On buffer: emit buffer_start and buffer_end with durations.
Example event object fields: timestamp, user_id, anon_session_id, event_name, position_ms, duration_ms, device_type, dupdub_voice_id, dupdub_language, dupdub_clone_id.

Compute ALTS: SQL and GA4 style

SQL (event table named media_events): SELECT session_id, MIN(timestamp) AS session_start, MAX(timestamp) AS session_end, SUM(CASE WHEN event_name IN ('play','resume') THEN played_seconds ELSE 0 END) AS total_listen_seconds FROM media_events WHERE media_id = 'X' GROUP BY session_id;
GA4-style (BigQuery export):
  • Filter events by event_name and event_params.position_ms.
  • Use session_id to sum play durations, subtract buffering and paused time.
Slice ALTS by DupDub metadata:
  • WHERE dupdub_language = 'es-ES'
  • GROUP BY dupdub_voice_id, device_type

Instrumentation gotchas
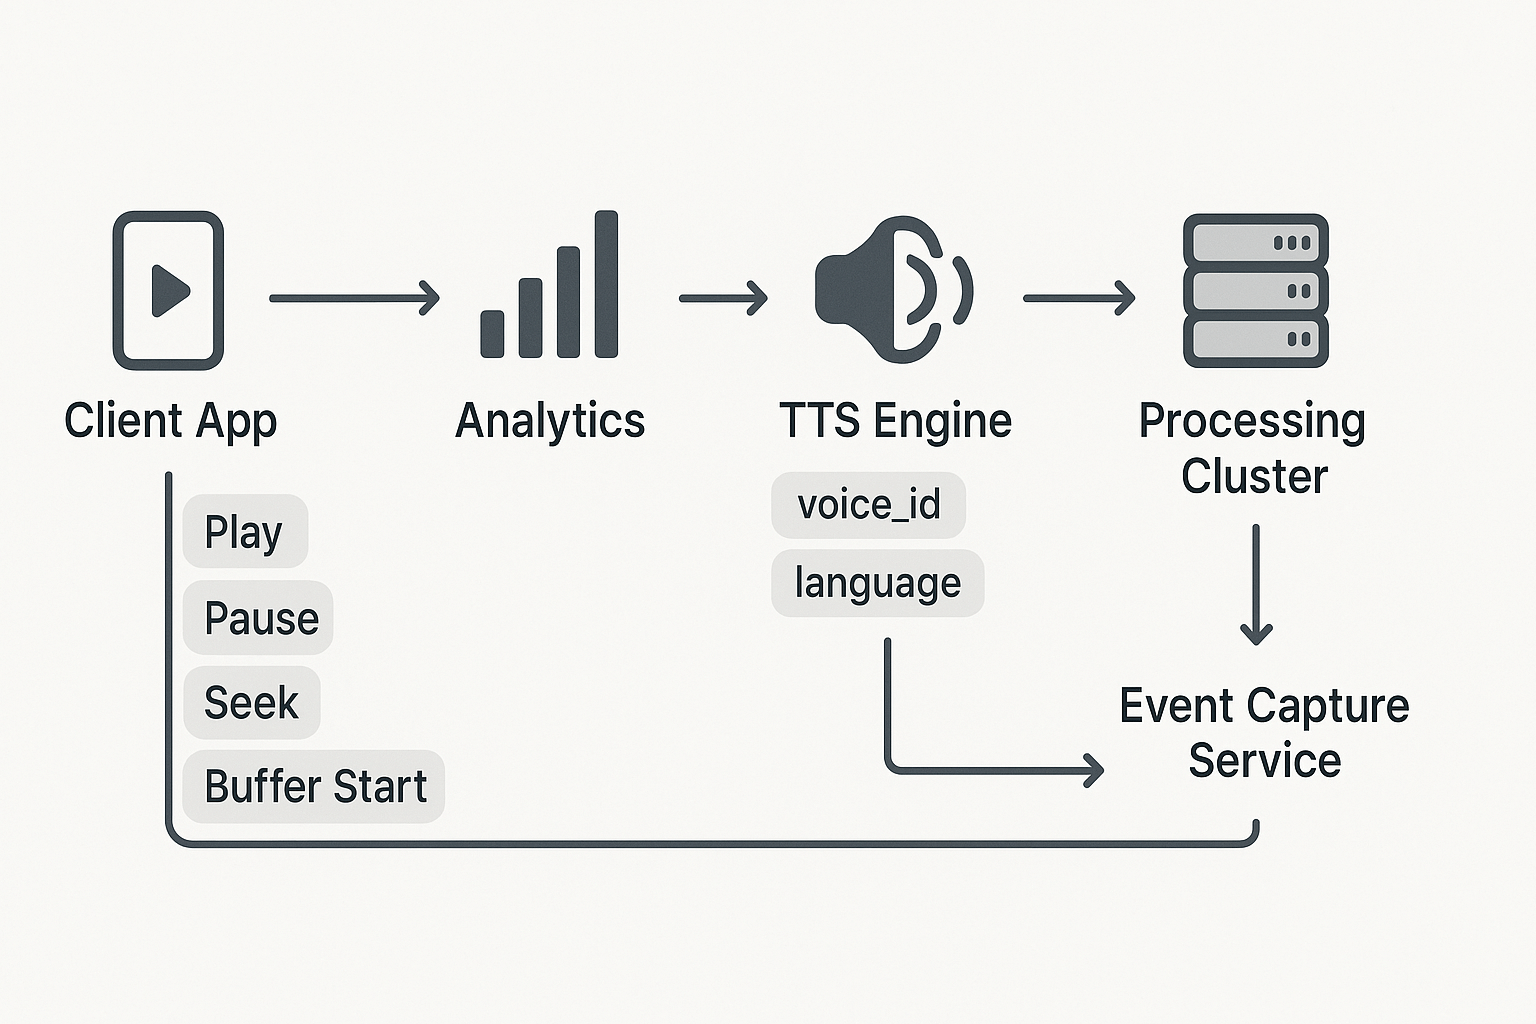
Auto-play can inflate session starts, so flag auto_play attribute and separate it. Buffering may split sessions: record buffer durations and subtract them from ALTS unless you want perceived engagement. Cross-device sessions need a stable user_id or server-side session stitching. Finally, verify voice_id and clone_id are immutable strings you can join on.
Workflow diagram showing client play to TTS tagging to event capture to ALTS processing, with buffering and sessionization nodes labeled.

How DupDub features can move the needle on ALTS (practical tactics)

A few targeted product moves can lift average listening time per session fast. This section shows concrete DupDub tactics that increase attention and reduce early drop offs, and it links those tactics to tts engagement metrics so teams can measure impact. Each tactic maps to an experiment you can run in days, not weeks.

Use higher naturalness voices and voice cloning to hold attention

Swap lower-quality TTS for DupDub's higher-naturalness voices and voice clones to raise perceived trust and reduce skim exits. Voice cloning (creating a branded voice from a short sample) keeps tone consistent across episodes, which improves familiarity and listening time. Implement voice variants as feature flags so analytics can compare session length per voice.
  • Test ideas: A/B test a standard TTS voice vs a cloned brand voice. Track median ALTS and 75th percentile session length.

Localize with native pacing and accent choices

Localization is more than language, it's rhythm and pacing that feel native to listeners. Use DupDub to produce language-specific pacing and local accents, and measure ALTS by locale to see lift. Small pacing tweaks often cut early drop rates in half for nonnative audiences.

Sync subtitles and mixed media to reduce early drop-offs

Add synced subtitles and caption cues to support audio, especially for short-form video and social clips. Subtitles help people start listening in noisy or quiet environments, which raises the chance they stay. Track session starts with and without captions to quantify impact.

Quick experiments to run with DupDub features

Run these lightweight tests to measure ALTS gains fast:
  1. Voice A/B: flag users into two groups, clone voice A for group A and standard TTS for group B. Compare median ALTS after 1,000 sessions.
  2. Localization flag: serve localized audio plus native pacing to half your traffic in a region. Measure change in session retention at 30 and 60 seconds.
  3. Caption sync: enable synced subtitles for 50% of plays on mobile, compare early drop rate.
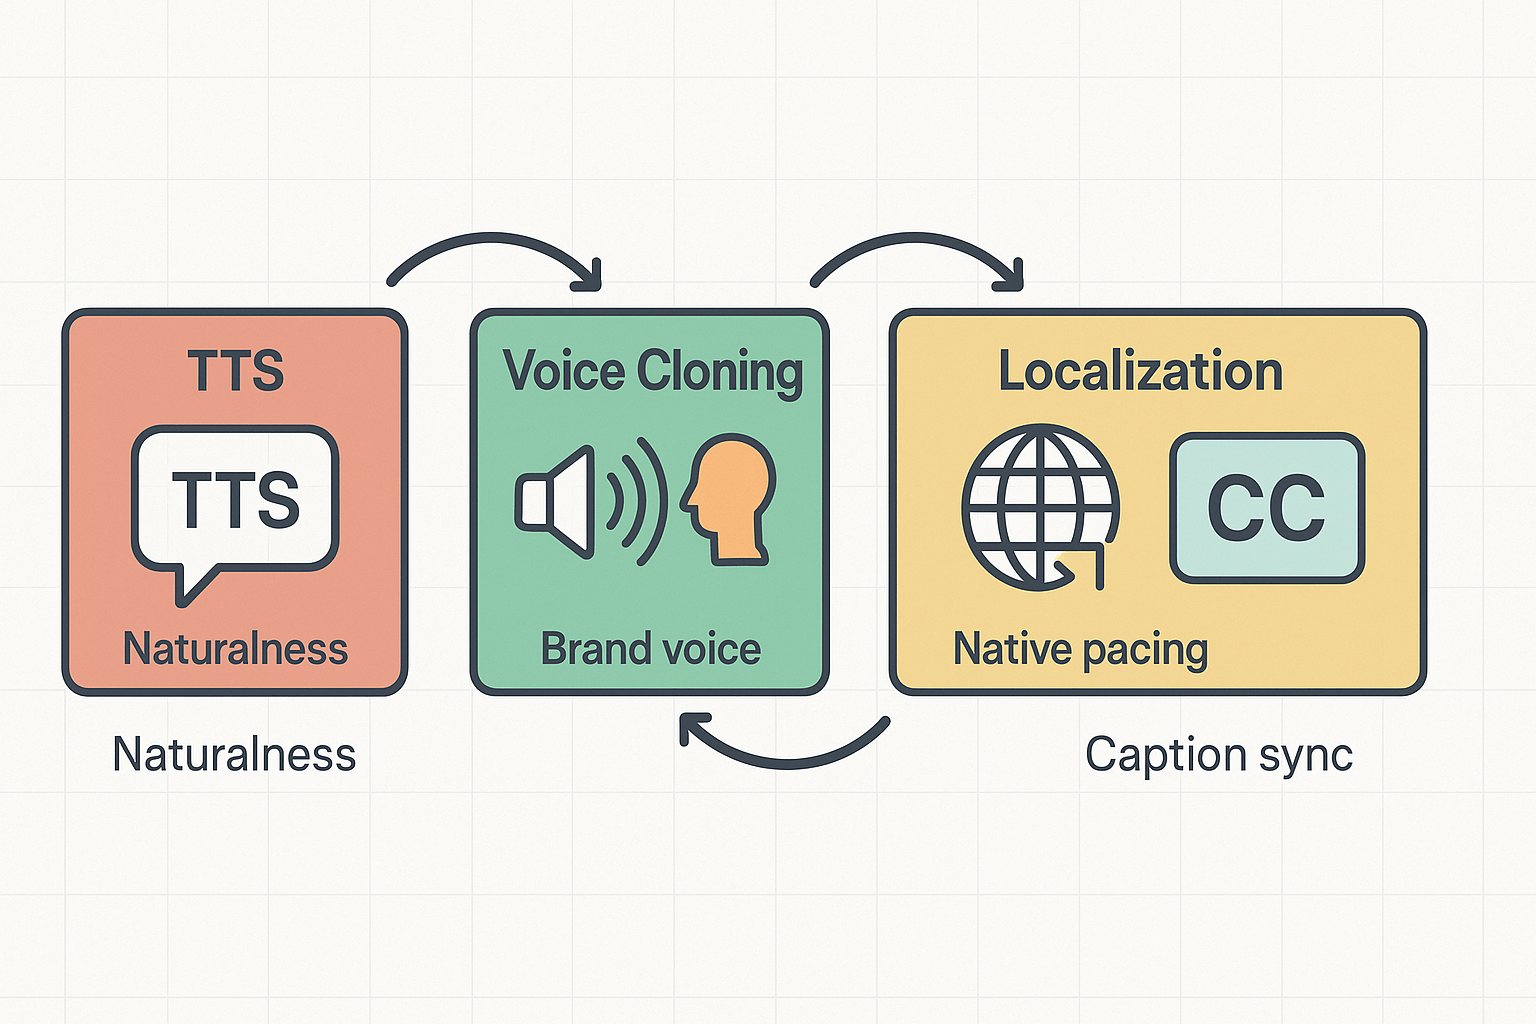
Each test should log voice_id, locale, caption_enabled, session_start, and session_end so you can compute ALTS precisely.
Icons for TTS, Voice Cloning, Localization, and Subtitles connected by arrows showing how each feature increases listening time and relevance.

A/B testing and experiment designs to improve ALTS

Quick experiments help teams raise average listening time per session while proving impact. This section gives ready-to-run templates, the metrics to track, and a simple way to calculate minimum detectable effect and sample size for tts engagement metrics.

Design templates and hypotheses

Use short, focused tests that change one dimension at a time. Examples:
  • Voice A (neutral male) vs Voice B (warm female): hypothesis, Voice B increases ALTS by 10 percent.
  • Localized audio vs original language: hypothesis, localized audio increases ALTS and completion rate.
  • Faster vs normal pacing: hypothesis, pacing cut improves short-form completion but may reduce comprehension.
State the hypothesis, primary metric, secondary metrics, and expected direction for each test.

Metrics to track per variant

Primary metric: ALTS per session (total listened seconds divided by sessions with audio start). Track it as a mean and median. Secondary metrics: completion rate, skip rate, replay rate, session length, and conversion (signup or course completion). Also capture segment breakouts by device, language, and traffic source.

Calculate MDE and sample size

For continuous ALTS use this sample size formula in words: n per variant = 2 * (Z(alpha/2)+Z(power))^2 * sigma^2 / delta^2. Estimate sigma (standard deviation) from a pilot. Example: baseline mean 120s, sigma 60s, target delta 12s (10 percent), Z(95% CI)=1.96, Z(80% power)=0.84 gives n ≈ 392 per variant.

Interpreting results and safe rollout

Check statistical significance and practical significance, and confirm secondary metrics show no regressions. Run subgroup checks, then rollout gradually: 10 percent, 50 percent, full traffic. If effects shift in subgroups, iterate with follow-up tests.

Mini case vignettes (data-driven examples)

These three short vignettes show how small audio and localization changes produced measurable Average Listening Time per Session gains. Each example lists the key events to track, a compact pseudo-query you can run, and the result interpretation for product and analytics teams focused on tts engagement metrics.

Short-form video: warmer voice, +12% ALTS

We swapped a synthetic voice for a warmer TTS voice and measured session-level listening time. Key events tracked: session_start, tts_play, tts_pause, tts_seek, session_end. Query: SELECT variant, AVG(listen_seconds) AS ALTS FROM sessions WHERE content_type='short_video' AND date BETWEEN '2025-01-01' AND '2025-01-14' GROUP BY variant; Result interpretation: The treatment group (warmer voice) showed a 12% higher ALTS. That suggests voice timbre improved engagement, not playback or load issues.

E-learning module: localization, +18% ALTS

We localized narration and subtitles for a module, then measured retention lift. Key events tracked: module_open, chapter_start, tts_language, chapter_complete, session_end. Query: SELECT language, AVG(chapter_listen_seconds) AS ALTS FROM learning_sessions WHERE module_id=123 GROUP BY language; Result interpretation: Localized tracks rose 18% in ALTS and had higher chapter completion. Localization reduced cognitive load and kept learners listening.

Podcast clips: shortened intro, +9% ALTS

We trimmed a long intro to cut early drop-off and tracked the effect. Key events tracked: clip_start, skip_intro, tts_play, first_minute_exit, session_end. Query: SELECT version, SUM(CASE WHEN first_minute_exit=1 THEN 1 ELSE 0 END)/COUNT(*) AS early_exit_rate, AVG(listen_seconds) AS ALTS FROM podcast_sessions GROUP BY version; Result interpretation: The short-intro variant lowered early exits and raised ALTS by 9%. Faster access to core content improved initial retention.
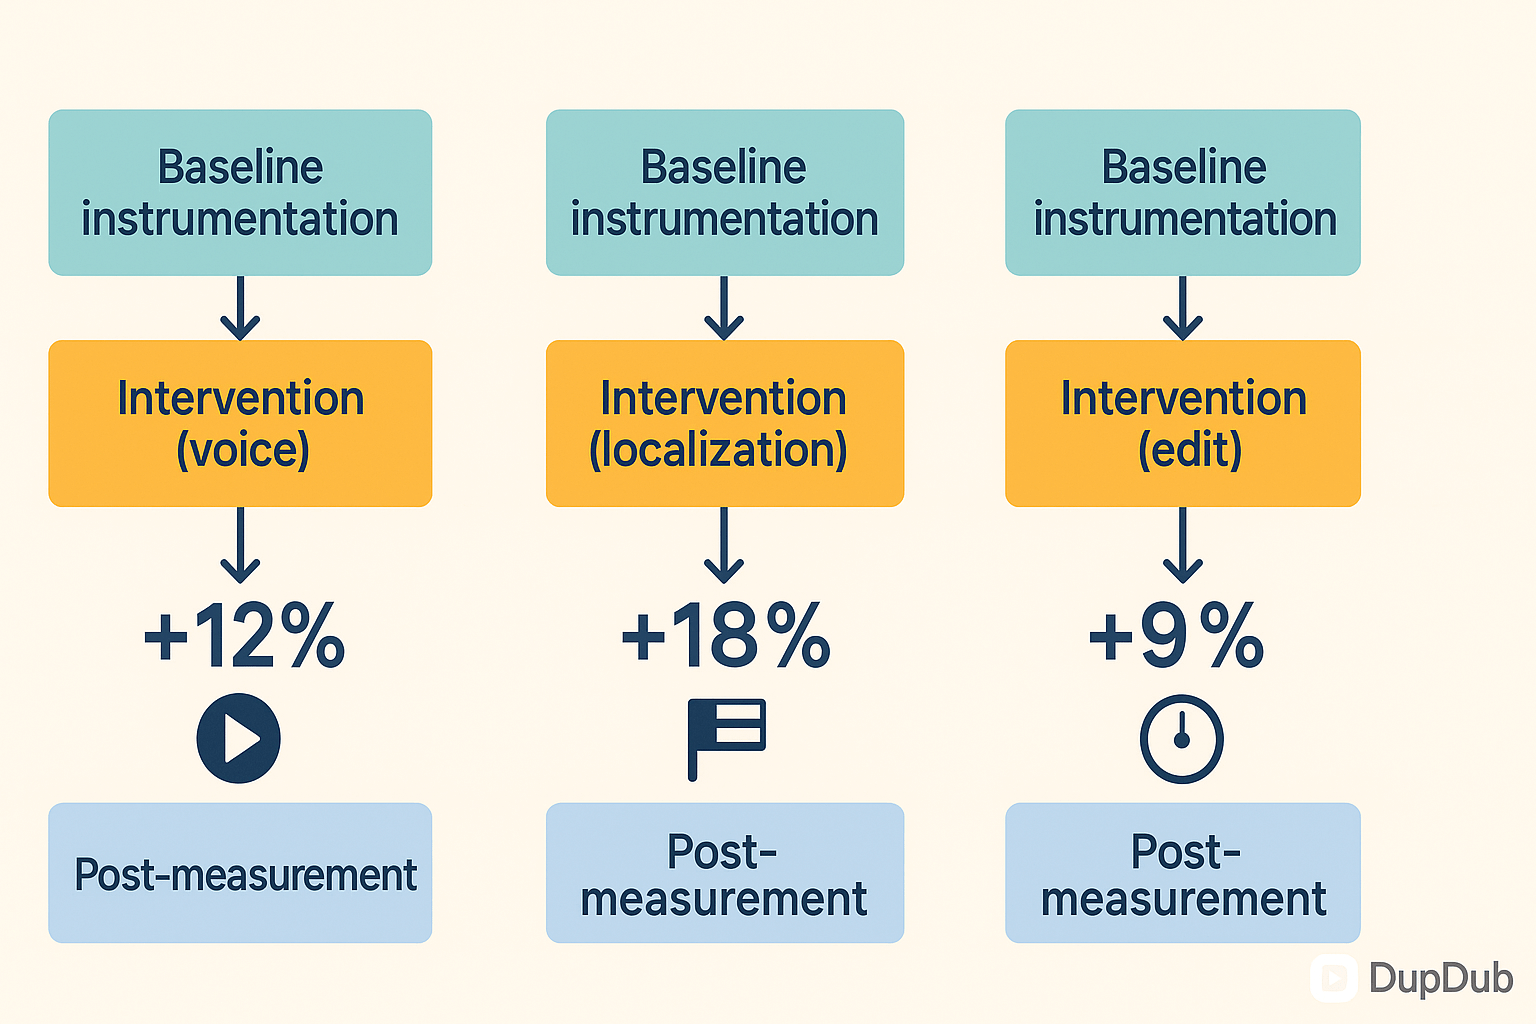
Three-panel workflow infographic showing baseline instrumentation, intervention, and post-measurement for three vignettes, with arrows labeled +12%, +18%, and +9%.

Implementation checklist, dashboard specs, and analytic queries

Start with a clear plan to instrument playback, label voices and languages, and build dashboards that track average listening time per session and related tts engagement metrics. This section gives a 90-day checklist, recommended widgets, sample queries for GA4 and Snowflake, and simple alert rules you can use right away.

90-day rollout checklist

  1. Days 0–14: Define events and names: session_start, session_end, play_start, play_progress, play_pause, play_seek. Require voice_id, voice_variant, language_code, and content_id on each event.
  2. Days 15–30: Implement client SDKs and server-side tracking. Emit play_position every 5–10 seconds for accurate ALTS.
  3. Days 31–45: Add metadata: clone_id, tts_engine, locale, experiment_variant.
  4. Days 46–60: Export GA4 or stream to Snowflake. Build ETL to compute session-level ALTS and enrich user cohorts.
  5. Days 61–90: Create dashboards, start A/B tests on voice, pacing, and language. Iterate and scale winners.

Dashboard widgets to build

  • ALTS trend over time (daily, 7-day MA).
  • Cohort retention curves by week and voice.
  • Drop-off heatmap (percent listened by second or percent).
  • Variant comparisons with lift, N, and p-value.

Pseudo queries and alert rules

GA4 pseudo-query: SELECT session_id, SUM(event_duration_seconds) AS alts FROM events WHERE event_name IN ('play_progress','play_start') GROUP BY session_id;
Snowflake pseudo-query: SELECT session_id, AVG(play_seconds) AS avg_alts, experiment_variant FROM analytics.playback WHERE content_id = :cid GROUP BY experiment_variant;
Alert rules:
  • Warning: 24h rolling ALTS drops >20% vs 7-day baseline.
  • Critical: 24h rolling ALTS drops >40% or variant lift negative and p < 0.05.
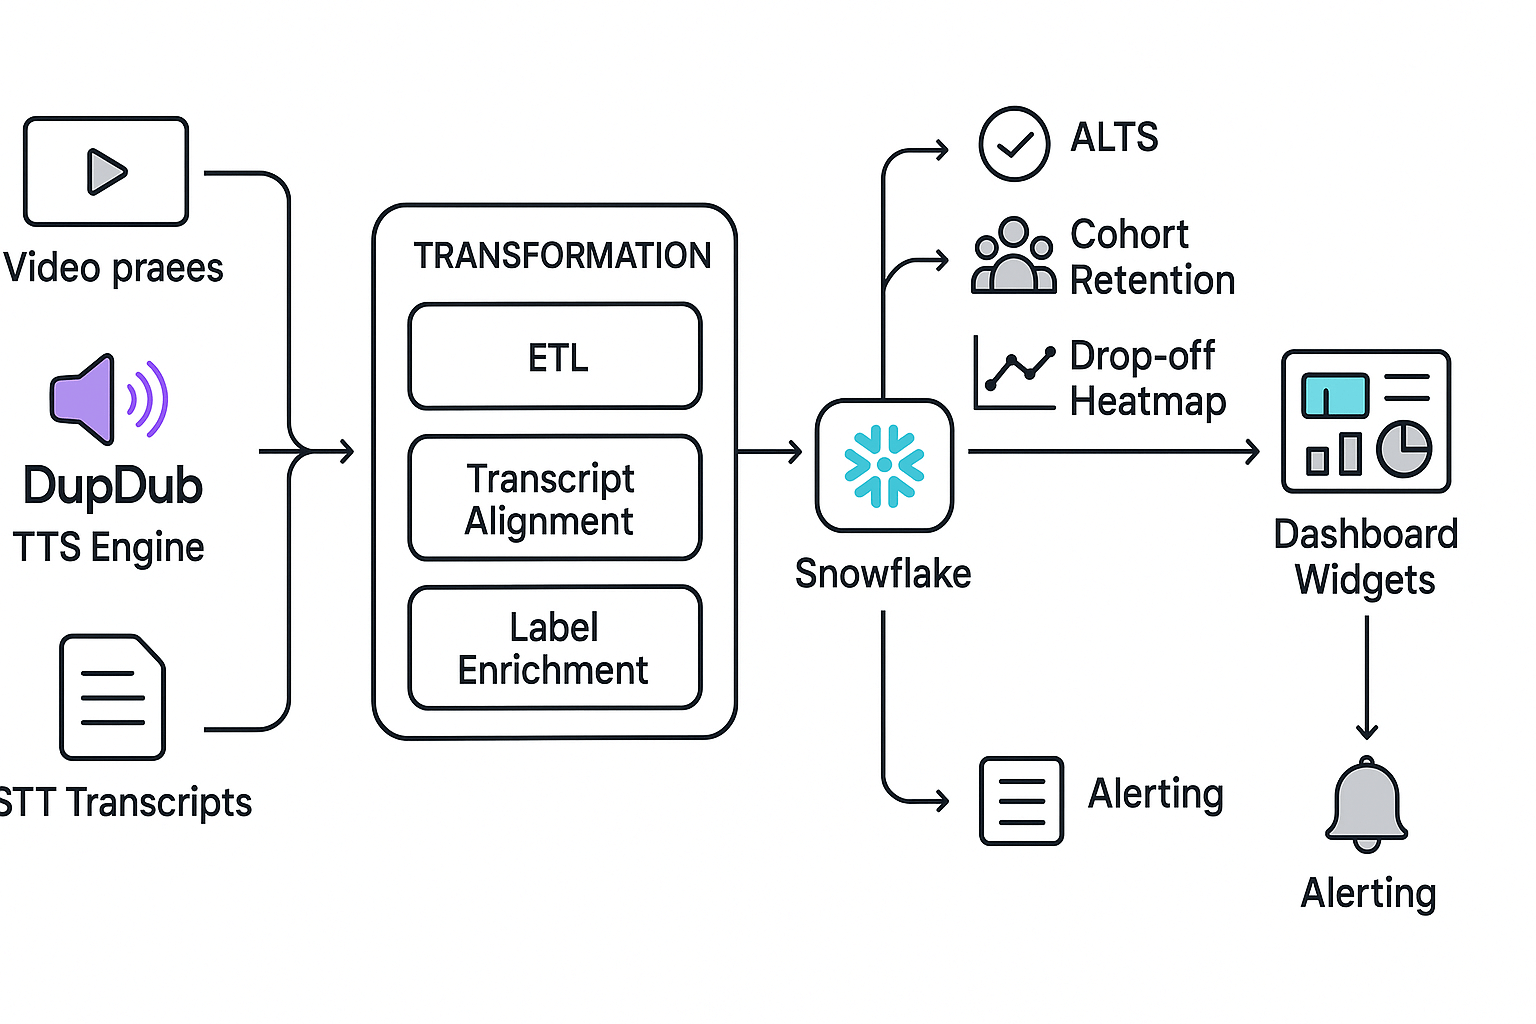
Dashboard flow diagram: data sources to ingestion to ETL to analytics and dashboard widgets, with alert nodes (16:9).

FAQ — Common questions about TTS engagement metrics and ALTS

  • How does average listening time per session differ from completion rate?

    Average listening time per session (ALTS) measures how many minutes users spend listening in each session, while completion rate measures the percentage of content finished. Use ALTS to track attention and engagement, and completion rate to evaluate task success or content effectiveness.

  • Do synthetic voices hurt trust and listening time?

    Not necessarily. High-quality, consistent synthetic voices can perform as well as human narration. To optimize results, A/B test tone, pacing, and clarity to match audience expectations and content style.

  • What are realistic ALTS benchmarks for podcasts, short-form video, and e-learning?

    Benchmarks vary by format: podcasts typically see 15–30 minutes per session, short-form videos aim for 50–80% of total runtime, and e-learning modules often target 70% or higher completion per session.

  • How fast can DupDub changes impact ALTS?

    Initial directional improvements can appear within days if traffic volume is sufficient. For statistically reliable results, aim for around 1,000 sessions per variant, which usually takes 1–4 weeks depending on audience size.

Experience The Power of Al Content Creation

Try DupDub today and unlock professional voices, avatar presenters, and intelligent tools for your content workflow. Seamless, scalable, and state-of-the-art.